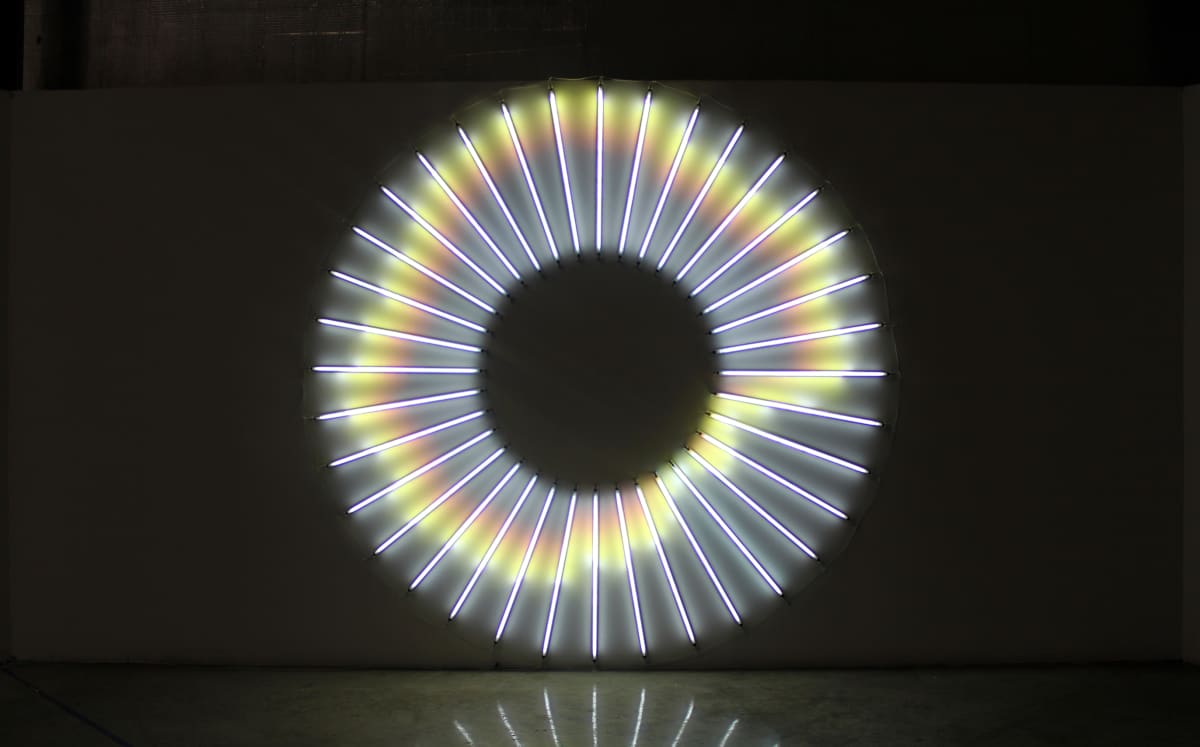


"NASDAQ Recursive Loop maps NASDAQ data from October 2007 till February 2011 onto a large circle of light. The higher the stock value the further from the center the line of light is shown. Starting from the top and going clockwise; the line shows the recession hitting around 2008 and slowly recovering, until Feb 2011 when the value is the same as before the crash in Oct 2007.
Edition of 3
--
Exhibited:
“Data Packets”, solo show, Galeria Senda, Barcelona, 2013
Contemporary Istanbul, 2013