Guild of Natural Science Illustrators
The GNSI is a 501(c)(3) that connects, provides professional development & networking opportunities to visual science communicators
Message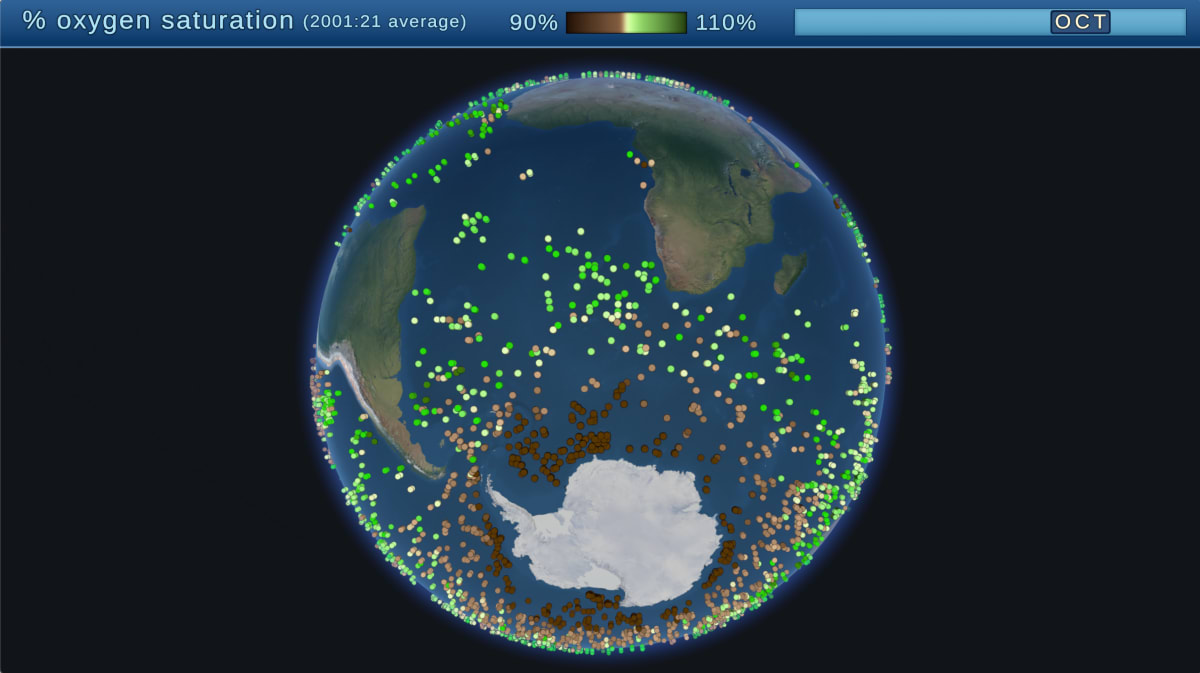
An animated visualization of seasonal changes in oxygen saturation, from data collected by a fleet of science instruments deployed throughout the oceans of the world. SOCCOM (The Southern Ocean Carbon and Climate Observations and Modeling project) uses this data to understand the oceans, especially the otherwise hard-to-access Southern Ocean, and model future effects on the Earth's climate.
©SOCCOM 2022
- Subject Matter: Data visualization animation